
The Health Care Select Sector SPDR Fund (XLV) is an exchange-traded (ETF) traded on the NYSE Arca. As of October 4, it had a closing price of $127.96 per share, showing a slight increase of $0.54 (+0.42%). The ETF has a 52-week range of $119.95 to $141.77, and its net assets are valued at approximately $37.92 billion. The net asset value (NAV) stands at $128.00 per share. It may present an exciting investment proposition with a price-to-earnings ratio (TTM) of 21.68 and a yield of 1.65%.
As of October 4, XLV closed at $127.96 per share, reflecting a modest uptick of $0.54 (+0.42%). This seemingly marginal figure bears significance when viewed alongside the ETF’s year-to-date daily total return, which currently stands at -4.67%. This downturn raises questions about the healthcare sector’s performance, prompting us to delve deeper into the underlying dynamics.
Crackdown on Healthcare Fraud: Lab Owner Minal Patel Sentenced to 27 Years

In recent news, a lab owner, Minal Patel, received a significant sentence of 27 years in prison for his involvement in a massive healthcare fraud scheme. Patel’s conviction stemmed from his orchestration of nearly $500 million in false claims submitted to Medicare for advanced cancer genetic tests. These fraudulent claims resulted in Medicare disbursing over $187 million in payments, ultimately defrauding the federal healthcare program.
Minal Patel’s ill-gotten gains from this scheme were astonishing, including acquiring a red Ferrari Spider and other luxury items. However, justice prevailed as a Miami federal judge has now ordered Patel to forfeit more than $187 million in proceeds from the scam. This includes $30 million in cash, the 2018 Ferrari Spider, and various real estate holdings. Such restitution is crucial in deterring fraudulent activities in the healthcare sector and upholding the integrity of Medicare, which primarily serves older Americans.
This case underscores the importance of combating healthcare fraud and upholding the sanctity of government-funded healthcare programs. Patel’s conspiracy with telemedicine companies, call centers, and patient brokers to induce Medicare beneficiaries into undergoing these unnecessary genetic tests highlights the need for enhanced vigilance and oversight in the healthcare industry.
Biotech Advancements and Pharmaceutical Strategies
![]()
Pioneering mRNA technology
Shifting gears to the biotech sector, Moderna has announced promising progress in developing a combination vaccine targeting both Covid and the flu, known as mRNA-1083. This vaccine has shown positive results in early to mid-stage trials and is poised to move into final-stage practice in adults aged 50 and above. If approved, it could simplify respiratory virus protection, addressing the seasonal threat of COVID-19 and the flu. The immune response generated by mRNA-1083 is comparable to or even better than existing flu vaccines, marking a significant step in respiratory virus prevention.
Moderna’s innovative approach to combination vaccines aligns with the industry’s pursuit of efficient solutions against respiratory viruses, including RSV. Pfizer and BioNTech are also in the race, with plans to launch their Covid and flu combination vaccine in 2024 or later. On the other hand, Novartis has just completed the spinoff of its generics and biosimilars business, Sandoz, as part of its strategic focus on becoming a pure-play innovative medicines company. This move is part of a broader trend among pharmaceutical companies seeking to streamline their operations and focus on their core strengths.
Combating Healthcare Fraud and Pharmaceutical Advancements

The conviction and sentencing of Minal Patel highlight the ongoing efforts to combat healthcare fraud. At the same time, the progress in combination vaccines, exemplified by Moderna’s mRNA-1083, offers a promising avenue for protecting against respiratory viruses. The pharmaceutical industry’s strategic moves, such as Novartis’ spinoff, reflect the evolving landscape of healthcare companies striving to excel in their respective areas of expertise.
Novartis’ commitment to innovation and its competitive pipeline, focused on key next-generation platforms and four core therapeutic areas, reinforces its position in the industry. The company remains steadfast in its guidance for FY 2023, with anticipated sales growth in the high single digits and core operating income in the low double digits to mid-teens. Novartis also affirms its consistent approach to capital allocation priorities, including share buy-back and a continued strong and growing dividend policy, with no re-basing after the Sandoz Spin-off. This strategic move reflects Novartis’ dedication to delivering value to its shareholders and sustaining its leadership in the pharmaceutical sector.
About A.J. Arenburg Financial
.png)
A.J. Arenburg Financial, headquartered in Jacksonville, Florida, specializes in investment banking and advisory services, focusing on the industrials, manufacturing, and AI-enhanced sectors. Our firm caters to a distinguished clientele, including premier boutique private equity firms, family offices, and entities with substantial annual revenues exceeding $10 million. We are adept at guiding family-owned and multi-generational businesses through sophisticated exit strategies, offering indispensable support for retiring owner-operators lacking succession plans.
Our comprehensive range of services merges exceptional investment opportunities with precise corporate finance expertise. We emphasize operational due diligence and strategic transaction advisory. Our Quality of Earnings Reports (QofE), a vital element of our financial due diligence process, provide essential insights for informed investment decisions. Our team, skilled in managing complex financial scenarios, devises strategic solutions that facilitate significant business transitions. With an extensive network in the private capital markets, A.J. Arenburg Financial commits to delivering efficient and reliable service, reinforcing our status as a trusted advisor for families and institutions on a global scale.
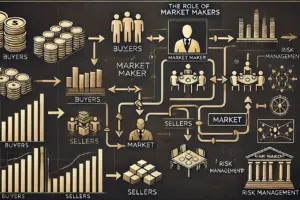
A Window Into Future Price Movements
Market makers ensure liquidity in the stock market by facilitating trades and matching buyers with sellers. Their activities, especially in the options market, can amplify stock price movements, sometimes leading to dramatic rallies or declines. This article explores the mechanics behind market maker operations, how they hedge risk and recent real-world examples of how their actions influenced notable stock movements.
The Spread ~ How Market Makers Profit
A market maker is typically a financial institution that ensures there is always a buyer and seller for a given security. They profit from the spread—the difference between the bid (the price buyers are willing to pay) and the ask (the price sellers are asking for). For instance, if a stock’s bid price is $100 and its ask price is $100.05, the market maker earns $0.05 per share traded if the buyer hits the ask. Beyond facilitating trades, market makers play a crucial role in the options market. When an investor buys a call or put option, the market maker takes the opposite side of the trade. This creates risk exposure, which market makers mitigate by employing delta hedging strategies.
When market makers sell call options, they are in a delta-negative position, meaning they lose money if the stock price rises. To balance this risk, they purchase a fractional amount of the underlying stock equivalent to the delta exposure, thereby achieving a delta-neutral position. For example, if a call option has a delta of 0.70 and represents 100 shares, the market maker will hedge by purchasing $70 worth of the underlying stock per contract. This hedging process drives up the stock price due to the additional buying pressure. Similarly, when selling put options, market makers are in a delta-positive position and hedge by selling or shorting a fractional amount of the underlying stock proportionate to the delta exposure. This hedging activity can contribute to downward price pressure when bearish sentiment dominates.
This dynamic often exacerbates rallies in certain equity securities. When a large number of call options are purchased, market makers are compelled to buy the underlying stock to hedge their exposure, increasing buying pressure and pushing the stock price higher. There are several recent examples that highlight this phenomenon. One of the most well-known cases is the GameStop short squeeze of early 2021. Retail investors coordinated on Reddit’s r/wallstreetbets to buy GameStop call options. Market makers who sold these calls were forced to hedge by buying GameStop shares. This hedging activity created significant upward momentum. As the stock price soared, institutional investors and hedge funds with short positions faced mounting losses and had to buy back shares to cover their positions. This short covering further accelerated the rally, causing GameStop’s price to peak at over $500 per share. The dynamic between retail call option buying and market maker hedging played a pivotal role in this historic short squeeze.
Another example occurred with Tesla in October 2021. On October 25, an influx of call option purchases totaled about $15 billion. Market makers who sold these calls had to hedge by buying Tesla shares, contributing to the price rally. This buying pressure helped Tesla’s stock climb to new highs, demonstrating how market maker hedging can amplify price movements when significant options activity occurs. (Source: YU Commentator)
From GameStop to Nvidia: How Hedging Moves Markets
In 2023, Nvidia saw substantial price gains due to heavy options trading. As call options were purchased, market makers hedged by buying Nvidia shares. This hedging activity compounded buying pressure, pushing the stock price higher. This rally highlighted how market makers’ need to balance delta exposure can lead to rapid price increases during periods of bullish sentiment. (Source: Opportunistic Trader)
More recently, European stocks in July 2024 saw significant volatility, especially around earnings releases. Hedge funds and institutional traders heavily influenced these movements through options trading. Market makers responded to these trades with aggressive hedging, amplifying the volatility. This case illustrates how market makers’ hedging strategies can lead to outsized moves during earnings seasons. (Source: Reuters)
In September 2024, a sudden market rally in China caused significant losses for hedge funds holding short positions. Market makers, who were exposed due to selling options, had to hedge by purchasing shares, which further fueled the rally. This rapid surge highlighted the risk of shorting in a market where sentiment can shift quickly, forcing hedging activity that exacerbates price movements. (Source: Reuters)
Understanding how to identify market maker activity can give investors a significant edge. One effective method is using scanners on trading platforms to detect unusual options volume relative to average trading levels. A spike in options volume, known as the sizzle index, can indicate institutional strategies at play. By drilling down into the specifics of large options trades—such as timing, strike prices, and volume—investors can glean insights into potential stock movements. Analyzing delta values can further clarify how market makers might hedge, revealing potential buying or selling pressures in the underlying stock.
Ultimately, market makers are indispensable to market liquidity, but their hedging activities can significantly impact stock price movements, sometimes leading to dramatic rallies or sell-offs. Real-world examples like GameStop, Tesla, and Nvidia highlight how market makers’ need to hedge options exposure can amplify market trends. By understanding these dynamics and recognizing unusual options activity, investors can better navigate market complexities and identify potential opportunities.
About A.J. Arenburg Financial

A.J. Arenburg Financial is an investment banking and strategic advisory firm located in downtown St. Petersburg, Florida. We specialize in complex transactional due diligence, including Quality of Earnings analysis, business valuation, and strategic growth advisory services. Serving family offices, private wealth management firms, boutique private equity firms, and generational organizations with revenues exceeding $10 million, we provide expert guidance in exit strategies, whether succession plans are in place or not. Our services also extend to interim and fractional CFO roles, offering essential support in preparing businesses for exit by optimizing revenues, consolidating debt, and reducing excessive expenses. As trusted intermediaries, we help businesses navigate acquisitions, divestitures, and capital-raising processes with precision and integrity.
Disclaimer
The information provided in this article is for educational purposes only and does not constitute investment advice or financial recommendations. A.J. Arenburg Financial does not offer personalized investment advice, and readers should consult with a licensed financial advisor or professional before making any investment decisions. The content is intended to enhance knowledge of market dynamics and the role of market makers in stock movements.

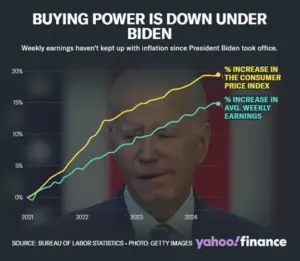
In recent months, the Biden administration has proudly claimed that inflation is down, citing falling numbers in the Consumer Price Index (CPI) as evidence that their policies are successfully cooling the economy. While some headline figures suggest a modest retreat from peak inflation levels, a closer look reveals that the real story of inflation is far more complex and, for many Americans, far more troubling.

The impact of inflation over the past few years is clear when we look at how much the value of money has changed. According to the U.S. Bureau of Labor Statistics’ CPI Inflation Calculator, $100 in January 2020has the same purchasing power as $122.03 in August 2024 (U.S. Department of Labor, Bureau of Labor Statistics). This represents a 22.03%increase in the cost of goods and services during that time.
This increase highlights the reality that everyday Americans are experiencing—prices for food, energy, housing, and other essentials have risen sharply. While the Biden administration continues to point to declining CPI numbers as a sign that inflation is under control, the fact remains that the cumulative effect of inflation over recent years has significantly reduced purchasing power. What used to cost $100 now costs more than $122, underscoring the real financial strain on households.
For many Americans, this kind of price increase means paying more for groceries, gas, and rent while wages have not kept pace. The administration’s focus on headline CPI numbers, which may show a recent slowing in inflation, fails to address this longer-term erosion of purchasing power—a burden that continues to weigh heavily on middle-class and lower-income families.
DEFINITION & MEASUREMENT OF INFLATION
Inflation is the rate at which the overall prices of goods and services increase, causing a reduction in the purchasing power of a country’s currency. According to the International Monetary Fund (IMF), inflation reflects the price hike over a specific period. It is generally a comprehensive gauge, encompassing a broad increase in prices or the rising cost of living within a nation. However, it can also be more narrowly focused on specific goods, like food, or services, such as a haircut. In any case, inflation indicates how much more costly the relevant set of goods and/or services has become over a specific period, typically a year.
The CPI without the core is often referred to as “headline CPI” or simply “CPI.”This version includes all items in the consumer basket, including the more volatile categories such as food and energy. In contrast, Core CPI excludes food and energy to provide a more stable measure of inflation trends. So, when people mention CPI without qualifying it as “core,” they typically refer to headline CPI, which reflects the full range of price changes consumers experience, including those for necessities like food and energy.
The Biden administration has repeatedly pointed to the decline in the Consumer Price Index (CPI) as proof that inflation is under control. However, this claim overlooks the reality that many Americans still feel the pinch of rising prices, especially when it comes to essential goods. While the CPI measures the average change in prices for a broad basket of goods and services, it doesn’t tell the full story. For instance, Core CPI, which excludes food and energy—the very things Americans rely on daily—may show more stability, but it doesn’t reflect the spikes in grocery bills or gas prices that households experience. By highlighting Core CPI figures, the administration sidesteps the real issue: rising food and energy costs continue to eat away at Americans’ purchasing power.
In reality, the administration’s focus on selective inflation metrics masks the more troubling aspect of inflation. Americans are still bearing the brunt of rising living costs, particularly for essentials like food and energy, which are conveniently omitted from the more favorable inflation figures being touted. Here is what really happened in August of 2024.
The Consumer Price Index for All Urban Consumers (CPI-U) increased by 0.2% in August 2024, matching the July increase, according to the U.S. Bureau of Labor Statistics’ most recent report, released on September 11, 2024. Over the past 12 months, the overall CPI rose by 2.5% before seasonal adjustment.
Key drivers of the increase included a 0.5% rise in the shelter index. The food index increased modestly by 0.1%, with food away from home rising 0.3%, while food at home remained unchanged. The energy index fell by 0.8% in August, following no change in the prior month.
Excluding food and energy, the CPI rose by 0.3% in August, compared to a 0.2% rise in July. Notable increases were seen in shelter, airline fares, motor vehicle insurance, education, and apparel, while used cars and trucks, household furnishings, medical care, communication, and recreation saw declines.
On a year-over-year basis, the overall CPI increased by 2.5%, the smallest 12-month gain since February 2021. The CPI excluding food and energy rose by 3.2%, while the energy index fell by 4.0% and the food index increased by 2.1% (U.S. Department of Labor, Bureau of Labor Statistics, September 11, 2024).
CURRENT CPI ANALYSIS: HOUSING, FOOD, AND ENERGY PRICES IN 2024
As of August 2024, the Consumer Price Index (CPI) data highlights several key trends in housing, food, and energy prices, painting a complex picture of inflation.
Housing and Rent Costs.
Housing remains one of the largest contributors to inflation. In August 2024, the shelter index rose by 0.5%, continuing its significant impact on overall inflation. Rent prices increased 0.4% during the same period, while home ownership costs also rose 0.5%. The persistent rise in housing costs is driven by a shortage of affordable housing, leading to ongoing pressures in the market despite broader inflation moderation. Over the last 12 months, housing costs have risen by 5.2%, making it a leading factor in overall inflation(Bureau of Labor Statistics)(Commercial Observer).
FOOD PRICES
Food inflation has slowed down but remains a concern. The overall food index increased 2.1% over the past year, but prices for essential groceries like meats, poultry, fish, and eggs surged by 0.8% in August alone, with the price of eggs spiking by 4.8%. Other categories, such as dairy, saw a 0.5% increase, indicating that certain staples remain expensive despite smaller gains in other areas like fruits, vegetables, and cereals(Bureau of Labor Statistics)(US Inflation Calculator).
ENERGY & FUEL PRICES
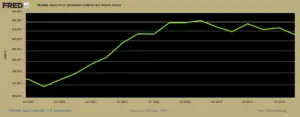
Energy prices are more volatile. In August, the energy index fell by 0.8%, with gasoline prices decreasing by 0.6% and fuel oil dropping by 1.9%. However, energy services, including electricity, rose by 3.1% year-over-year. These fluctuations in energy prices reflect ongoing global factors, including supply chain disruptions and geopolitical tensions, which continue to influence energy costs (Bureau of Labor Statistics).
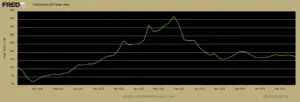
Using the global energy price index data, we can observe significant volatility over the period from January 2020 to August 2024. The index began at 128.14 on January 1, 2020, and ended at 178.79 in August 2024, representing an increase of 39.52% over this time. However, the index peaked at over 360 in 2022, a dramatic rise triggered by factors such as the war in Ukraine, global supply disruptions, and increased demand during the post-pandemic recovery. While prices have declined since the 2022 high, they remain considerably above pre-pandemic levels.
This sustained elevation in energy costs exacerbates financial pressure on consumers. While inflation may be slowing in certain areas, housing costs continue to rise, and food prices remain high for essential goods. Energy prices are more mixed, with some sectors seeing relief and others continuing to rise. These trends suggest that consumers, especially those dealing with housing and grocery costs, are still facing significant financial strain despite official claims of inflation cooling.
BROADER INFLATIONARY CHALLENGES BEYOND THE HEADLINE CPI
Despite a moderating overall inflation rate, deeper structural and external factors continue to exert pressure on both consumers and the economy at large.
WAGE PRICE GAP
Wage growth has not kept pace with rising prices, especially in essential categories like food, housing, and energy. Although wages have risen by approximately 4.5% over the past year, this increase has been outstripped by inflation in housing costs (up 5.2%) and ongoing energy price volatility. This gap between wages and cost-of-living increases is leaving many households with reduced purchasing power and financial strain (Bureau of Labor Statistics).
SUPPLY CHAIN & GLOBAL FACTORS
Ongoing global disruptions, including geopolitical tensions, commodity shortages, and trade bottlenecks, continue to affect certain sectors. For example, energy prices remain highly volatile, and food prices remain elevated, particularly for essentials like meat and dairy. These supply chain disruptions are amplified by events such as the Ukraine war, which has had a significant impact on both energy and agricultural commodity markets(Bureau of Labor Statistics)(Commercial Observer).
In response to persistent inflation, the Federal Reserve has continued to raise interest rates, which now hover between 5.25% and 5.5% as of August 2024. While this aggressive rate hike strategy aims to cool inflation, it has also led to increased borrowing costs, making mortgages, loans, and credit card debt more expensive for consumers and businesses. The housing sector, in particular, has been heavily impacted, with rising interest rates contributing to increased costs for potential homeowners and renters(Commercial Observer).
The massive fiscal stimulus and monetary expansion during the pandemic have contributed to lingering inflationary pressures. The infusion of liquidity into the economy boosted demand across many sectors but also created supply-side constraints that have persisted well into 2024. This imbalance between supply and demand has contributed to higher prices for goods and services despite efforts by policymakers to bring inflation down(US Inflation Calculator).
POTENTIAL HIDDEN INFLATION
While the CPI provides an overall snapshot of inflation, it may understate the real impact on consumers. “Shrinkflation” (reduced product sizes for the same price) and “skimpflation” (reduced quality of services without price reductions) are two forms of hidden inflation that affect purchasing power without being fully captured in official inflation data. These subtle changes in product and service delivery leave consumers facing higher costs indirectly, even if headline inflation numbers are stabilizing(Bureau of Labor Statistics).
While there are signs of cooling inflation in certain sectors, a range of factors — from wage stagnation to global supply chain disruptions, high borrowing costs, and hidden inflation — continue to challenge the economic recovery. The persistence of elevated costs in housing, energy, and food, combined with the long-term effects of pandemic-era fiscal policies, means that for many Americans, financial relief is still a distant prospect.
ABOUT A.J. ARENBURG FINANCIAL

A.J. Arenburg Financial, located in St. Petersburg, Florida, is a private investment bank and advisory firm specializing in the industrials, healthcare, and technology sectors. We offer a comprehensive range of services, including buy and sell-side transaction advisory, acquisition and divestiture assistance, and funding solutions through private debt and equity capital raising. Our expertise extends to transactional due diligence, encompassing Quality of Earnings analysis, business valuation, and strategic growth advisory services, including fractional CFO services.

On Friday, August 16, 2024, Vice President Kamala Harris unveiled an economic plan centered on addressing the affordability crisis in housing and reforming tax policies. While her proposals may seem promising on the surface, a deeper examination reveals potential pitfalls that could have significant negative consequences for the U.S. economy. This article will critically analyze the critical components of Harris’s plan, focusing on the $25,000 down payment assistance for first-time homebuyers, the proposal to eliminate taxes on tips, and the rumored implementation of price controls on groceries.
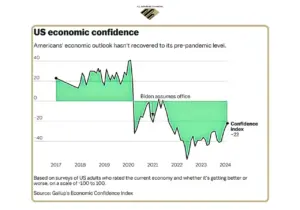
The below chart titled \”US Economic Confidence\” highlights the steep decline in Americans’ economic outlook, particularly after President Biden assumed office. The data, based on surveys from Gallup’s Economic Confidence Index, shows that confidence levels were relatively stable and positive from 2017 through 2019. However, starting in 2020, coinciding with the COVID-19 pandemic, confidence plummeted into negative territory. Despite some fluctuations, the confidence index has struggled to recover, remaining significantly below pre-pandemic levels, with a recent index reading of -22. This ongoing lack of confidence underscores the challenges the current administration faces in stabilizing and improving the economic outlook, which raises further concerns about the viability and timing of Kamala Harris’s proposed economic policies.
Borrowing from Trump’s Playbook: Taxation Policy on Tips
Kamala Harris’s proposal to eliminate tips taxes is intriguing and controversial, especially since it mirrors a policy introduced by Donald Trump earlier this year. This raises questions about the originality of Harris’s economic strategy. More importantly, it directly contradicts her administration’s actions. In February 2023, the Treasury Department and IRS, under her watch, rolled out the Service Industry Tip Compliance Agreement (SITCA) to increase tip reporting compliance. This move imposes greater regulatory burdens on service workers rather than alleviating them. Here is the link to the IRS page, proving the contradiction in Kamala’s attempt to fool voters.
This stark contradiction between her past support for increased regulation and her current promise to eliminate tip taxes raises doubts about the sincerity of her proposal. Is this a genuine shift in policy aimed at supporting service industry workers or merely a political maneuver designed to attract voters? Harris’s inaction on this issue during her tenure, despite ample opportunity to address it, suggests the latter. Furthermore, her role in casting the tie-breaking vote for the Inflation Reduction Act, which significantly increased taxes and government spending, further complicates her current stance. The video of Kamala Harris casting the tie-breaking vote for the Inflation Reduction Act illustrates her support for policies that expand government oversight and taxation, which seems at odds with her newfound advocacy for reducing tax burdens on tips.
The timing of her proposal, so close to an election and after years of policy contradictions, makes it difficult to view it as anything more than a political tactic rather than a commitment to meaningful economic reform.
Harris’s Housing Proposal: A Path to Economic Instability and Government Overreach
Kamala Harris’s ambitious housing plan, which includes building 3 million new units and providing $25,000 in down payment assistance to first-time buyers, is fraught with economic risks. While the intention is to make homeownership more accessible, this policy could have severe unintended consequences. Injecting such a substantial amount of money into the market without addressing underlying supply issues risks artificially inflating home prices. Sellers, aware of the $25,000 handout, might simply raise their prices, effectively negating any benefit for buyers and driving up overall market costs.
Moreover, the financial implications are staggering. If Harris’s $25,000 down payment plan is applied to the 3 million new homes she proposes to build, the taxpayer burden would amount to $75 billion. But this figure only scratches the surface. According to the National Association of Realtors, 5 to 6 million new homebuyers enter the market each year. If all these buyers were to receive the proposed $25,000, the cost to taxpayers could balloon to between $125 billion and $150 billion annually. Such massive expenditures, shouldered by taxpayers, could inflate a housing bubble reminiscent of the 2008 financial crisis. The increased risk of defaults, as buyers who might not otherwise qualify for mortgages struggle to meet their payments, could trigger a market collapse.
In addition to these risks, Harris’s plan to limit investors who buy homes in bulk and her push for fast-tracking permitting could further exacerbate market instability. Limiting investors could reduce rental housing availability, pushing more people into homeownership before they are financially prepared and increasing the likelihood of defaults. The rapid push for new housing, including the repurposing of federal land, risks creating poorly planned developments with inadequate oversight, potentially leading to long-term economic harm.
This heavy government involvement in the housing market echoes similar government overreach seen in other areas, such as efforts to control the food supply. By dictating who can buy homes, how they can buy them, and even where they can be built, the government could gradually take over critical sectors of the economy. If the government continues down this path, controlling not only housing but also food and other essential markets, the risk of creating a dependency on government intervention becomes real. This could undermine market freedoms and economic stability, leading to a situation where the government, rather than market forces, dictates the direction of the economy.
In essence, while Harris’s proposal may seem like a solution to housing affordability, it could have the opposite effect. Increased prices, market instability, and significant financial risks to the economy as a whole could be the unintended consequences of these policies, potentially leading to another housing crisis and a significant taxpayer burden.
Price Fixing: A Dangerous Path to Socialism
Kamala Harris’s proposal to implement price controls on groceries is not only an economically dangerous path but also mirrors the strategies of socialist regimes that have led to disastrous outcomes. The Vice President’s plan includes a federal ban on what she terms \”price gouging\” by food suppliers and grocery stores. While this might sound like a protective measure for consumers, history shows that price controls often lead to severe market distortions, shortages, and a crippled economy.
A clear example of this can be seen in Venezuela under Hugo Chávez, where similar price-fixing strategies led to widespread shortages of basic goods, black markets, and an eventual economic collapse. By trying to curb prices through government mandates, Harris risks driving away investment, reducing the incentive for producers to bring goods to market, and creating the very shortages she aims to prevent. The potential consequences of such a policy in the United States could be dire, leading to decreased availability of essential goods, long lines, and a situation where the government gains increasing control over the economy—a hallmark of socialist governance.
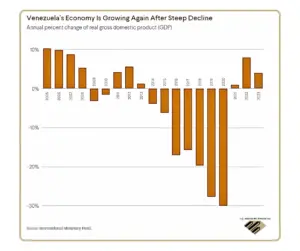
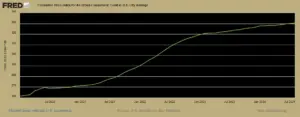
The chart titled \”Venezuela’s Economy Is Growing Again After Steep Decline\” illustrates the annual percentage change in the real gross domestic product (GDP) of Venezuela from 2005 to 2023. The chart shows positive growth in the mid-2000s, with GDP increasing by nearly 10% per year. However, starting in 2009, the economy experienced a significant downturn, with a steep decline beginning in 2014 and continuing until 2020 when the GDP contracted by as much as 30%. The trend of economic contraction is particularly severe between 2015 and 2020, reflecting the impact of price controls, economic mismanagement, and other factors associated with the socialist policies implemented by the Venezuelan government. The chart also shows a slight recovery starting in 2021, with GDP growth turning positive again in 2022 and 2023, suggesting a modest economic rebound after years of decline.
This visual evidence underscores the dangers of aggressive government intervention in the economy, such as price controls, and serves as a cautionary example of the potential risks associated with similar policies being proposed in the United States.
Harris’s push for price controls is reminiscent of other government overreach efforts seen in sectors like housing, where her proposed $25,000 down payment assistance could artificially inflate home prices and lead to a housing bubble. The combination of these policies points to a broader agenda that seeks to control key aspects of the economy, potentially leading the U.S. down a path of increased government intervention and market destabilization.
The Hidden Dangers of Kamala Harris’s Economic Plan: How Price Controls and Housing Policies Could Lead to Market Instability
In summary, Kamala Harris’s recently unveiled economic plan, though seemingly well-intentioned, is fraught with significant risks that could have far-reaching negative consequences for the U.S. economy. Her proposal to eliminate taxes on tips, while appealing on the surface, contradicts her administration’s previous actions that increased regulatory burdens on service workers, and is a direct theft from the Trump economic policy agenda. This raises serious doubts about the sincerity of her promises and whether they are genuinely aimed at supporting workers or simply a political maneuver.
Furthermore, her ambitious housing plan, including the $25,000 down payment assistance, is riddled with potential pitfalls. By injecting billions into the housing market without addressing the underlying supply issues, Harris risks inflating home prices, increasing the likelihood of a housing bubble, and potentially triggering another economic crisis similar to the 2008 financial collapse. The taxpayer burden of such policies is staggering, and the consequences could be dire, leading to widespread defaults and market instability.
Perhaps most concerning is her proposal to implement price controls on groceries—a policy that dangerously echoes the failed strategies of socialist regimes like Venezuela. History has shown that such measures often lead to severe market distortions, shortages, and economic collapse. Harris’s push for government control over essential markets like housing and food could set the U.S. on a dangerous path toward increased government intervention and decreased economic freedom, undermining the very foundations of a free-market economy.
Ultimately, while Harris’s proposals may be presented as solutions to pressing economic issues, the reality is that they could lead to increased prices, market instability, and a significant burden on taxpayers, all while expanding government control over critical sectors of the economy. These policies, if implemented, could have the opposite effect of what is intended, potentially causing more harm than good to the American economy.
Vice President Harris has been in office for over three years and has not made any significant progress in supporting her policy agenda. In fact, she has done the opposite.
About A.J. Arenburg Financial

A.J. Arenburg Financial, located in St. Petersburg, Florida, is a private investment bank and advisory firm specializing in the industrials, healthcare, and technology sectors. We offer a comprehensive range of services, including buy and sell-side transaction advisory, acquisition and divestiture assistance, and funding solutions through private debt and equity capital raising. Our expertise extends to transactional due diligence, encompassing Quality of Earnings analysis, business valuation, and strategic growth advisory services, including fractional CFO services.
Each of these bubbles followed a similar pattern: rapid price increases fueled by speculation, followed by a sudden and severe market correction. These historical examples highlight the dangers of excessive leverage, overvaluation, and speculative behavior. They also underscore the importance of regulatory measures and prudent investment strategies to mitigate the risks associated with market bubbles.
Understanding past market bubbles can help investors and policymakers identify potential warning signs and take proactive steps to prevent similar occurrences in the future. At A.J. Arenburg Financial, we are committed to providing our clients with the insights and strategies needed to navigate these complex market dynamics effectively.
Mark Spitznagel, a prominent fund manager known for his “Black Swan” strategy, has raised alarms about the current state of the markets. He argues that we are in the midst of the greatest credit bubble in human history, with the potential for a severe market correction. According to Spitznagel, the Federal Reserve’s policies and the excessive debt levels pose significant risks to the stability of financial markets.
Brief History of US Market Bubbles
The market bubbles discussed below are some of the major events in financial history. While there have been numerous other global and domestic recessions and depressions, we have selected these well-known examples to provide a clear understanding for our readers. Each of these market bubbles followed a similar pattern: rapid price increases fueled by speculation, followed by a sudden and severe market correction. These historical examples highlight the dangers of excessive leverage, overvaluation, and speculative behavior. They also underscore the importance of regulatory measures and prudent investment strategies to mitigate the risks associated with market bubbles.
The 1920s Stock Market Bubble
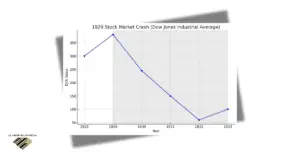
The 1920s, also known as the “Roaring Twenties,” saw a period of great economic prosperity in the United States. Prior to the Wall Street crash of 1929, share prices jumped dramatically. The Dow Jones Industrial Average (DJIA) increased sixfold from August 1921 to a peak of 381 in September 1929. However, this rapid growth was unsustainable, and on October 24, 1929, known as “Black Thursday,” the market closed at 299.5, marking a 21% decline.
A selling panic ensued, leading to a further decline of approximately 13% on October 28. The following day, “Black Tuesday,” saw the market drop again by nearly 12%. This crash continued until 1932, ultimately resulting in the Great Depression, a period during which stocks lost almost 90% of their value. The Dow Jones did not fully recover until November 1954.
Two primary factors are commonly cited as triggers for the crash: the efforts by governors of many Federal Reserve Banks and a majority of the Federal Reserve Board to combat market speculation and a significant expansion of investment trusts, public utility holding companies, and margin buying.
The 1980s Japanese Asset Bubble
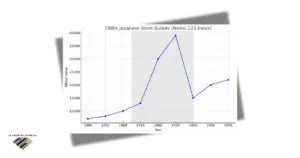
While not a U.S. market bubble, the 1980s Japanese asset bubble had significant global implications. Japan’s stock market and real estate prices skyrocketed due to speculative investments and accommodative monetary policy. At the peak, Tokyo’s real estate was valued higher than the entire state of California.
The asset bubble was largely fueled by the Bank of Japan’s policy of keeping interest rates very low, encouraging borrowing and speculative investment. Between 1985 and 1989, the value of Japanese stocks tripled, and urban land prices in Japan’s major cities increased dramatically. By 1989, the value of the Imperial Palace grounds in Tokyo was said to be worth more than the entire state of California.
The bubble burst in the early 1990s, leading to a sharp decline in both stock and real estate prices. The Nikkei 225, Japan’s premier stock index, fell from a peak of nearly 39,000 in December 1989 to around 14,000 by August 1992. The bursting of the bubble led to a prolonged period of economic stagnation in Japan, known as the “Lost Decade.” During this time, Japan experienced deflation, a banking crisis, and a sluggish economy. The repercussions of the bubble’s burst were felt throughout the 1990s and beyond, with the Japanese economy struggling to recover fully.
The Dot-Com Bubble
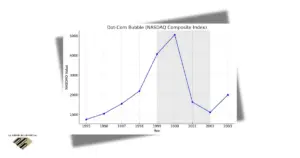
The Dot-Com Bubble formed as a result of a surge of investments in Internet and technology stocks. The increasing popularity of the Internet led to massive speculative investments in “new economy” businesses. The start-up hype that drove prices peaked in March 2000. By December 2000, the Nasdaq 100 index had lost more than half of its peak value, and the index wouldn’t notch a new high until 2017.
Massive amounts of venture capital were poured into tech and Internet startups, while investors purchased shares in these companies, hoping for success. This speculative frenzy led to an unsustainable market environment. The NASDAQ Composite Index, heavily weighted with tech stocks, soared from about 750 in 1990 to over 5,000 by March 2000. However, by October 2002, the index had fallen by 78%, wiping out $5 trillion in technology-firm market value and triggering a U.S. recession. Despite the collapse, some tech giants like Amazon and Google emerged stronger and more resilient.
The Housing Bubble
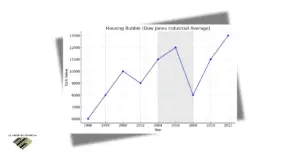
The early 2000s witnessed a massive bubble in the U.S. housing market, driven by easy credit and speculative buying. Home prices nearly doubled between 1996 and 2006, with much of the increase occurring in the final years. The bubble burst in 2008, leading to the financial crisis and the Great Recession. The average U.S. home lost about one-third of its value, causing widespread economic hardship and a prolonged recovery.
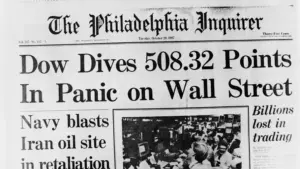
On September 29, 2008, the stock market fell 777.68 points in intraday trading, marking the biggest point drop in history at that time. The immediate cause of the market crash was Congress’ initial refusal to pass the bank bailout bill designed to stabilize the American financial system after a series of historic shocks. The bill finally passed on October 3, 2008.
On March 5, 2009, the Dow Jones closed at 6,926, a drop of more than 50% from its pre-recession high. This period highlighted the dangers of excessive leverage and speculative behavior in the housing market, leading to a severe financial crisis and a prolonged economic downturn.
The 2020 COVID-19 Pandemic Bubble

The onset of the COVID-19 pandemic in early 2020 led to one of the fastest market crashes in history, followed by an equally rapid recovery. Massive fiscal stimulus and unprecedented monetary easing led to a significant rebound in stock prices, particularly in technology and stay-at-home stocks. However, the rapid recovery also raised concerns about overvaluation and potential future corrections.
The 2020 coronavirus stock market crash is the most recent U.S. crash, triggered by panic selling following the onset of the COVID-19 pandemic. On March 16, the drop in stock prices was so sudden and dramatic that a Level 1 market-wide circuit breaker was issued at 9:30 a.m. From February 12 to March 23, the DJIA lost 37% of its value, and NYSE trading was suspended several times.
Despite this dramatic downturn, the stock market rebounded strongly. On August 18, 2020, the S&P 500 was hitting record highs, and on November 24, 2020, the DJIA crossed 30,000 for the first time in history. This period underscored the volatility and unpredictability of the markets during unprecedented global events and highlighted the significant impact of fiscal and monetary policy interventions.
The Signs of a Bubble
High Valuations and Market Crashes

High valuations often precede market crashes, as they indicate that asset prices have risen significantly above their intrinsic values, driven by speculative investments. Historically, several major market crashes have followed periods of excessively high valuations. For example, the 1929 Stock Market Crash, which led to the Great Depression, was preceded by extremely high stock prices fueled by speculative investments and margin buying. Similarly, the Dot-Com Bubble of 2000 saw the NASDAQ Composite Index peak due to speculative investments in internet stocks, resulting in a significant crash.
During the 2008 Financial Crisis, excessively high home prices and speculative real estate investments led to a severe market downturn. The COVID-19 pandemic also triggered a rapid correction in high-valued technology and stay-at-home stocks, although massive fiscal and monetary interventions led to a swift recovery.
- 1929 Crash ~ 89% market decline due to excessive speculation.
- Dot-Com Bubble (2000) ~ 78% drop in NASDAQ.
- 2008 Financial Crisis ~ Real estate bubble burst.
- COVID-19 Crash (2020) ~ Rapid correction in high-valued stocks.
These examples highlight the cyclical nature of financial markets and the risks associated with high valuations, underscoring the importance of prudent investment strategies and regulatory measures to mitigate potential market crashes.
Excessive Speculation and Market Crashes
Excessive speculation often leads to market crashes, as it involves risky investments with the hope of substantial gains, driving asset prices far beyond their intrinsic values. Historically, several major market crashes have been preceded by periods of excessive speculation. The 1929 Stock Market Crash, fueled by rampant speculation and margin buying, led to the Great Depression. The Dot-Com Bubble of 2000 saw speculative investments in internet stocks, causing the NASDAQ Composite Index to peak and then plummet.
Similarly, the 2008 Financial Crisis was exacerbated by speculative real estate investments, leading to a severe downturn. The COVID-19 pandemic also saw speculative investments in technology and stay-at-home stocks, resulting in a rapid correction.
- 1929 Crash ~ Driven by rampant speculation.
- Dot-Com Bubble (2000) ~ Speculative tech investments.
- 2008 Financial Crisis ~ Speculative real estate investments.
- COVID-19 Crash (2020) ~ Speculative tech stocks.
These examples highlight the dangers of excessive speculation and the importance of regulatory measures and prudent investment strategies to prevent market crashes.
Leverage and Debt in Market Crashes
Leverage and debt significantly contribute to market crashes by amplifying financial instability. High levels of borrowing can lead to rapid asset price inflation, which, when corrected, results in severe market downturns. The 1929 Stock Market Crash saw extensive margin buying, where investors borrowed heavily to buy stocks, leading to catastrophic losses. The 2008 Financial Crisis was fueled by excessive mortgage debt, causing widespread defaults and a severe economic downturn. Similarly, the COVID-19 pandemic highlighted vulnerabilities in corporate debt structures, exacerbating market volatility.
- 1929 Crash: Extensive margin buying.
- 2008 Financial Crisis: Excessive mortgage debt.
- COVID-19 Crash (2020): Corporate debt vulnerabilities.
These cases emphasize the dangers of excessive leverage and debt, highlighting the need for prudent financial practices and regulatory oversight to mitigate the risks of market crashes.
Market Sentiment and Market Crashes
Market sentiment, the overall attitude of investors towards a particular market or asset, can significantly influence market crashes. When sentiment is overly optimistic, it can drive prices to unsustainable levels, leading to eventual corrections. The 1929 Stock Market Crash was fueled by extreme optimism and overconfidence in the market. The Dot-Com Bubble saw euphoric sentiment towards internet stocks, resulting in inflated valuations. Similarly, the 2008 Financial Crisis was preceded by a positive sentiment in the housing market, which led to excessive risk-taking.
- 1929 Crash: Extreme market optimism.
- Dot-Com Bubble (2000): Euphoric sentiment towards internet stocks.
- 2008 Financial Crisis: Positive housing market sentiment.
These examples illustrate the impact of market sentiment on financial stability, emphasizing the need for balanced perspectives and cautious investment strategies to mitigate the risks of market crashes.
Predicting Market Peaks and Potential Corrections

Predicting the exact timing of a market peak is inherently challenging, but several factors could trigger a correction in today’s market. Rising interest rates are a primary concern, as they can increase borrowing costs, reduce consumer spending, and lower corporate profits. The Federal Reserve’s policy changes are closely monitored as they significantly impact market dynamics. Additionally, signs of an economic slowdown, such as decreasing GDP growth or rising unemployment rates, can trigger market corrections. The anticipated slowdown in GDP growth for 2024 is a potential red flag. Regulatory changes also play a crucial role; increased regulation in key sectors like technology and finance can affect market sentiment and lead to corrections. Upcoming regulatory changes regarding data privacy, antitrust actions, or environmental policies could impact market stability.
Several companies and industries today exhibit characteristics reminiscent of past market bubbles. In the technology sector, stocks like Apple and Nvidia have seen significant price increases, driven by hype around artificial intelligence (AI) and other tech innovations. This mirrors the speculative fervor seen during the dot-com bubble of the late 1990s. The real estate market, while not as overheated as during the 2008 crisis, still shows signs of overvaluation driven by low interest rates and speculative buying. Cryptocurrencies also demonstrate speculative behavior, with substantial price fluctuations in assets like Bitcoin indicating potential market corrections.
Given these potential risks, investors should exercise caution. Diversifying portfolios, focusing on fundamental analysis, and preparing for potential volatility are crucial strategies to mitigate the risks associated with a market correction. While it is impossible to predict with certainty when or if a market bubble will burst, current signs suggest that prudent investment strategies and regulatory oversight are essential in navigating these uncertain times.
Companies to Watch
- Apple
- Nvidia
- Tesla
- Bitcoin and other cryptocurrencies
These companies and assets should be monitored closely due to their significant price increases and speculative behaviors, which are indicative of potential market bubbles.
The examination of past market bubbles reveals common themes of high valuations, excessive speculation, leverage, and shifting market sentiment. Each of these factors has historically contributed to dramatic market corrections, whether during the 1929 Stock Market Crash, the Dot-Com Bubble, the 2008 Financial Crisis, or the more recent COVID-19 pandemic. In today’s market, several indicators suggest we might be on the verge of similar corrections. Companies like Apple, Nvidia, and Tesla, along with assets like Bitcoin, exhibit significant price increases fueled by speculative behaviors, particularly driven by the hype around AI and other technological advancements.
Expert opinions reinforce these concerns. Analysts from Citi, Piper Sandler, and other financial institutions highlight the parallels between current market conditions and past bubbles, particularly noting the speculative fervor in the tech sector. The rapid growth of AI-related stocks, especially Nvidia, draws comparisons to the late 1990s dot-com bubble, signaling potential overvaluation risks.
Given these warning signs, it is prudent for investors to exercise caution. Strategies such as diversifying portfolios, focusing on fundamental analysis, and preparing for potential market volatility are essential to mitigate the risks of a market correction. Although predicting the exact timing of a market peak is challenging, staying informed and vigilant about market conditions can help navigate these uncertain times effectively.
About A.J. Arenburg Financial
A.J. Arenburg Financial, located in St. Petersburg, Florida, is a private investment bank and advisory firm specializing in the industrials, healthcare, and technology sectors. We offer a comprehensive range of services, including buy and sell-side transaction advisory, acquisition and divestiture assistance, and funding solutions through private debt and equity capital raising. Our expertise extends to transactional due diligence, encompassing Quality of Earnings analysis, business valuation, and strategic growth advisory services, including fractional CFO services.
Sources
- Stock Market Crash: 5 Experts Who Think the Bubble Is Close to Bursting
- ‘Warning Flags’: Expert Says Nvidia In ‘Bubble-ish Territory,’ Points To Potential Market Pullback – Benzinga
- Is Nvidia Stock, AI a Bubble? Citi Says 2024 is Shaping Up to Be a Repeat of 1999 – Investing.com
- Nvidia: a Market Bubble Waiting to Burst – UnHerd

A fractional CFO provides part-time, contract, or as-needed CFO services. As businesses grow and their financial situations become more complex, they need a skilled financial leader. However, for many small to medium-sized enterprises, hiring a full-time CFO may not be practical or affordable. This is where a fractional CFO can make a big impact. We will explore what a fractional CFO is, their role within a company, and the benefits they offer to your business.
Fractional CFOs streamline financial operations and systems to make them more efficient and effective. They often introduce or improve technology solutions to automate and streamline financial operations, making them more accurate and timely. Furthermore, fractional CFOs provide detailed financial reports, offering deep insights into the company’s financial performance. This data-driven approach to decision-making ensures that business strategies are backed by solid financial analysis, guiding the company towards its financial goals.
As small businesses expand, they often reach a point where their financial challenges become too complex for the existing team to handle effectively. This is when they need the expertise of a CFO to navigate financial complexities, manage cash flow, and drive strategic growth. However, the cost of a full-time CFO can be prohibitive, leaving many businesses without the crucial financial leadership they need. Many entrepreneurs excel in their core business activities but struggle with the financial management aspects. The intricacies of budgeting, forecasting, financial
reporting, and strategic planning can be overwhelming and confusing. This gap in expertise can hinder growth, lead to missed opportunities, and increase financial risks.
Focusing on the vision!
A fractional CFO steps in to bridge this gap, providing the same level of expertise and strategic insight as a full-time CFO but on a flexible, cost-effective basis. They bring a wealth of experience in financial management and can offer valuable guidance on critical financial decisions. With a fractional CFO, small businesses gain access to high-level financial strategies for their specific needs, helping them to scale smartly and sustainably.
Additionally, by hiring a fractional CFO, business owners and visionaries can focus on what they do best—driving the vision and growth of the business. This allows entrepreneurs to devote their energy and talents to their core competencies, knowing that their financial management is in capable hands.
In the following sections, we will discuss the specific roles and responsibilities of a fractional CFO and outline the key benefits they bring to small businesses.
Roles of a Fractional CFO
Fractional CFOs oversee a company’s financial operations, provide strategic guidance, and help the organization achieve its financial goals. Their duties encompass a range of critical financial functions. They develop budgets, forecasts, and financial models to support decision-making and drive business growth. They monitor and optimize cash flow to ensure the company has sufficient funds to meet its obligations and invest in growth opportunities. Additionally, they prepare accurate and timely financial statements, ensuring compliance with accounting standards and regulations.
In terms of risk management, fractional CFOs identify and mitigate financial risks, including those related to market fluctuations, regulatory changes, and operational issues. They also collaborate with the executive team to develop long-term financial strategies and evaluate potential opportunities, such as mergers and acquisitions or new product development. By handling these essential tasks, fractional CFOs provide the financial leadership necessary to guide small businesses through complex financial landscapes and support their strategic objectives.
Benefits of a Fractional CFO for Business Owners
- Cost-effective access to high-level financial expertise.
- Strategic financial planning support for business growth.
- Improved cash flow management.
- Accurate and timely financial reporting
- Enhanced decision-making through strategic guidance
Hiring a fractional CFO can be a wise financial decision for small to medium-sized businesses. The cost savings of employing a fractional CFO versus a full-time CFO can be significant and make this option more affordable for businesses with limited resources. Fractional CFOs are able to offer flexibility by customizing their services to suit the specific needs of each client, whether on a project basis or for a specific duration. Their expertise, which often covers a range of industries, enables them to provide valuable insights and best practices that can help businesses succeed and grow. As your business expands, a fractional CFO can adjust the scope of their services to provide the financial leadership needed to navigate new challenges and ensure sustained success. Moreover, a fractional CFO brings an external perspective to the table, offering impartial viewpoints and fresh ideas and identifying areas for improvement within your business. This external perspective can be particularly valuable for businesses looking to innovate and stay ahead in a competitive market.
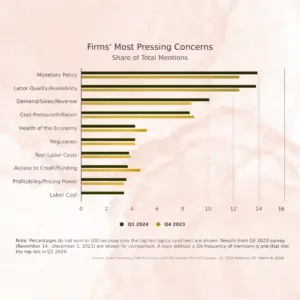
Top Concerns of Today’s CFO’s
In today’s ever-evolving economic landscape, businesses face a myriad of challenges that require astute financial management and strategic foresight. According to recent surveys from the Richmond Fed, CFOs have consistently identified monetary policy and labor quality and availability as top concerns, reflecting the complex and dynamic nature of the current business environment. Against this backdrop, the role of a fractional CFO has never been more crucial. Fractional CFOs offer cost-effective access to high-level financial expertise, providing strategic financial planning, risk management, and compliance assurance. By streamlining financial operations and systems, they help businesses adapt to economic uncertainties and drive growth. Moreover, their role in comprehensive financial reporting and analysis ensures that businesses can make informed, data-driven decisions in response to evolving economic conditions. As businesses navigate these challenges, the expertise and flexibility of a fractional CFO can serve as a valuable asset in achieving long-term financial stability and success.
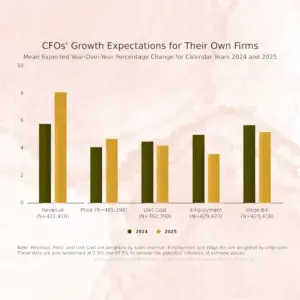
Additionally, the recent Richmond Fed report shows that CFOs have shown positive growth expectations for their firms in the first quarter of 2024. Mean year-over-year percentage changes for calendar years 2024 and 2025 indicate an anticipated revenue growth of 5.8% and 8.1%, respectively, up from 3.7% in 2023. Price growth is expected to be 4.1% for 2024, slightly lower than the 4.3% in 2023, while unit cost growth is projected to be 4.5%, down from 5.4% in 2023. Employment growth is expected to be 5.0% in 2024, down from 4.6% in 2023, and the wage bill is anticipated to grow by 5.7% in 2024, up from 6.0% in 2023. Additionally, 47% of firms increased spending (excluding capital expenditures) in the past three months, marking a 4 percentage point increase from the previous quarter’s survey. These findings are based on data from 390 to 429 U.S. firms responding to the Q1 2024 survey conducted from February 20 to March 8, 2024.
Get The Help Your Business Deserves!
Fractional CFOs offer a valuable solution for small to medium-sized enterprises (SMEs) that need financial expertise but may not require a full-time CFO. These professionals provide part-time, contract, or as-needed CFO services, helping businesses streamline financial operations, introduce technology solutions, and provide detailed financial reports. By bridging the gap between financial complexity and affordability, fractional CFOs enable SMEs to access high-level financial strategies and guidance, supporting smart and sustainable growth.
Hiring a fractional CFO can be a wise decision for SMEs, offering cost-effective access to high-level financial expertise and strategic financial planning support. These professionals help improve cash flow management, provide accurate financial reporting, and enhance decision-making through strategic guidance. As SMEs expand, fractional CFOs can adjust their services to meet evolving needs, providing the financial leadership necessary to navigate new challenges and ensure sustained success. Their external perspective can also offer impartial viewpoints and fresh ideas, helping businesses innovate and stay competitive in their markets.
At A.J. Arenburg Financial, we specialize in strategic growth and exit planning for businesses. Our experienced team can provide fractional CFO services tailored to your specific needs, helping you optimize financial operations, manage cash flow effectively, and make informed strategic decisions. Whether you need assistance with budgeting, forecasting, financial reporting, or strategic planning, we can provide the expertise and guidance you need to drive your business forward. Contact us today to learn more about how we can help you achieve your financial goals.
About A.J. Arenburg Financial

A.J. Arenburg Financial is a St. Petersburg-based private investment bank and advisory firm serving the industrials, healthcare, and technology sectors. Our services include mergers and acquisitions advisory, facilitating both buy-side and sell-side transaction advisory with expertise in transactional due diligence and strategic implementation. Complementing these core offerings, we provide access to private debt and equity for working capital needs, precise business valuation, and strategic advisory to maximize enterprise value. Our clients include lower and middle-market businesses, family offices, trusts, boutique institutions, and private equity firms.

Deciding to sell a business is a monumental decision that requires careful consideration of various factors. Whether it’s to capitalize on hard-earned sweat equity or as part of a retirement plan, understanding the motivations and timing for selling a business is crucial. While there are many valid reasons to sell, there are also pivotal moments when selling might not be the best choice.
Business owners choose to sell their enterprises for a variety of strategic and personal reasons. Whether driven by the desire to capitalize on their investment, pivot to new opportunities, or address unforeseen circumstances, the decision to sell is often influenced by a combination of factors that ensure both their financial and personal goals are met.
Here are some common reasons for selling a business:
- Retirement ~ After successfully operating a business for decades, many owners decide to sell when they feel ready to retire. This allows them to enjoy the fruits of their labor and ensures the business continues under new leadership.
- Health Issues ~ Deteriorating health can prompt business owners to sell. Ensuring the business is in good hands while focusing on personal health becomes a priority.
- Lifestyle Changes ~ Shifts in lifestyle or personal circumstances can also drive the decision to sell. Whether it’s relocating, pursuing new interests, or spending more time with family, these changes often necessitate stepping away from the business.
However, certain situations might make selling an inopportune time. Understanding these can help business owners avoid potential pitfalls.
When Not to Sell Your Business
Early Growth Phase
Selling a business just because it has reached $1 million in EBITDA (Earnings Before Interest, Taxes, Depreciation, and Amortization) can be premature. Often, achieving this milestone is a sign of recent exponential growth, especially for lower-market private companies. These businesses might have been operating in a steady state for many years and have only recently experienced significant growth due to new initiatives or technological advancements.
- Future Potential ~ Reaching the $1 million EBITDA mark often indicates the beginning of a new growth phase. Selling at this stage might mean missing out on the full potential value of the business.
- Growth Drivers ~ If the recent growth is driven by new technologies or market strategies, it may be wise to capitalize on these drivers for a few more years to maximize the business’s valuation.
Maximizing the Value of Your Business
When it is time to sell your business, it’s essential to consider engaging a proficient investment banker or business broker. Having an advisor who truly understands the intricacies of the process will help maximize the company’s intrinsic value, or “true” value.
Intrinsic Value Assessment
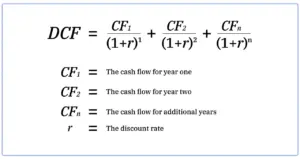
This involves running detailed numbers to ascertain the business’s real worth. Two common valuation methods used by M&A advisors are the discounted cash flow (DCF) method and the relative, comparable, or multiple method.
- Discounted Cash Flow (DCF) Method ~ This method is often more precise. It examines the present value of future cash flows and forecasts based on historical data, providing a deeper understanding of the company’s financial health and future potential.
- Multiple Method ~ Although widely used, the multiple method can be less accurate. It involves applying a multiple to the company’s EBITDA to estimate its value. While this method can sometimes align with DCF valuations, it can also result in significant undervaluation.
For instance, if a company with $1 million in EBITDA is valued at 5x EBITDA, it’s worth $5 million. However, if the intrinsic value, calculated through DCF, suggests a multiple of 5.5x or 6x, the actual value could be $5.5 million or $6 million. A proficient banker would recognize this and negotiate accordingly, ensuring the client receives full value. Even if the extra turn is negotiated on an earnout contingency, it’s worth it!
Negotiation Leverage
By running a DCF, bankers gain a comprehensive understanding of the company’s operations and financials. This knowledge is invaluable during negotiations and helps in effectively representing the company’s true value.
In summary, while the multiple methods might provide a ballpark figure, a detailed DCF analysis can uncover the full potential value of a business. This thorough approach not only maximizes the sale price but also ensures that the business owner receives the fair value of their enterprise. Engaging a knowledgeable and experienced advisor is key to navigating this complex process and achieving the best possible outcome.
About A.J. Arenburg Financial
A.J. Arenburg Financial is a St. Petersburg, Florida-based private investment bank & advisory extending its services across the industrials, healthcare, and technology sectors. Our expertise encompasses buy and sell-side transaction advisory, facilitating seamless acquisitions and divestitures for our clientele. Complementing this core service, we offer comprehensive solutions, including private capital raising, complex transactional due diligence, precise business valuation, and strategic M&A advisory.